2 Creating a Productive Programming Environment
Just as chefs depend on sharp knives and well-organized kitchens to prepare great meals, data scientists rely on finely tuned programming environments to produce clear, reliable visualizations and analyses. In this chapter, we will install the programming language R and the integrated development environment (IDE) Positron—your digital knife and cutting board—so that you can focus on creativity rather than technicalities. In tandem, R and Positron offer many useful features that support a data scientist’s workflow, from handling raw data to producing polished reports and visualizations.
Section 2.1 and Section 2.2 will guide you through the installation of R and Positron, respectively. Section 2.3 will then suggest a beginner-friendly configuration for Positron.
2.1 Installing R
R is a programming language originally developed in the early 1990s by Ross Ihaka and Robert Gentleman, two statistics professors from the University of Auckland in New Zealand (Vance, 2009). Initially intended only to support statistics teaching in their department, R has become popular among statisticians and data scientists worldwide because it is free, open-source, and runs on all common operating systems. Additionally, R has an active community of developers who contribute packages that extend the language’s functionality. Consequently, R offers efficient solutions to a wide array of complex problems in statistics, data analysis, visualization, and report writing.
Admittedly, in its original form, R reflected design choices suitable for its time rather than current standards. However, these limitations have been overcome by modern add-on packages that offer efficient and user-friendly alternatives. This book will make extensive use of the tidyverse suite of packages, which are optimized for performance and possess consistent user interfaces. Because the tidyverse is actively developed, its packages are continually improved and expanded.
The programming language R is extensively used in statistics and data science. The tidyverse, a suite of add-on R packages, provides efficient and user-friendly solutions for complex tasks, such as data visualization.
The installation method for R varies depending on your operating system. The instructions below are up-to-date as of May 2026 (R version 4.6.0).
2.1.1 Installing R on Windows
Please download the R binaries for the base distribution from https://cran.r-project.org/bin/windows/base/. Then double-click the downloaded file and follow the on-screen instructions to complete the installation. The installer’s default settings are suitable for most users.
2.1.2 Installing R on macOS
It is advisable to install R using an installer package tailored to your hardware. If you have a recent Mac, it likely has a processor based on the ARM64 architecture. You can find out your processor architecture by clicking the Apple icon in the top left corner; then select “About This Mac” from the dropdown menu. If your chip name starts with “Apple,” your processor is based on ARM64. In this case, download the most recent ARM64 (“Apple Silicon”) installer for R from https://cran.r-project.org/bin/macosx/. If you have an older Mac, you may need the R version for an Intel processor, which can be downloaded from the same website. In both cases, double-click the downloaded file to start the installation process. Then follow the on-screen instructions to complete the installation. For most users, the installer’s default settings are acceptable without modification.
2.1.3 Installing R on Ubuntu
Please right-click anywhere on the Ubuntu desktop and select “Open in Terminal” from the context menu. Then enter the following commands in the Terminal window and press the Return key after each command. You may be prompted to enter your Ubuntu password; note that you will not see any characters while typing:
sudo apt update -qq

sudo apt install --no-install-recommends \
  software-properties-common dirmngr

wget -qO- \
  https://cloud.r-project.org/bin/linux/ubuntu/marutter_pubkey.asc |
  sudo tee -a /etc/apt/trusted.gpg.d/cran_ubuntu_key.asc

sudo add-apt-repository \
  "deb https://cloud.r-project.org/bin/linux/ubuntu \
  $(lsb_release -cs)-cran40/"

sudo apt install --no-install-recommends \
  r-base r-base-dev
2.1.4 How to Use R?
There are various ways to write and run R programs. For instance, you can write the code using any conventional text editor, such as the pre-installed applications Notepad on Windows or TextEdit on macOS. After saving the R code, it can be executed from the Command Prompt on Windows or a Terminal on macOS and Linux. For certain applications, running code from the Command Prompt or Terminal might be the only available option (e.g., when running an R program on a remote server).
However, most of the time, it is more advantageous to use an integrated development environment (IDE). An IDE combines writing and running code in a single user interface. The next section will guide you through the installation of Positron, a powerful IDE for R programming.
2.2 Installing Positron
Positron is a free, source-available IDE for data science, built on Code OSS, the open-source foundation of Microsoft Visual Studio Code. It provides native support for R and Python and ships with built-in support for Quarto, an authoring framework covered in Chapter 3. It also includes interactive tools for data exploration, such as a data viewer, a plot pane, and a variable explorer. Many add-on tools are available through Open VSX, an open-source registry for extensions compatible with VS Code. Positron also includes a context-aware coding assistant powered by artificial intelligence (AI). Together, these features make Positron a versatile tool for data scientists and statisticians, and therefore the IDE of choice for this book.
Positron is an IDE for data science workflows in R and Python.
To install Positron, navigate to https://positron.posit.co/download and accept the license agreement and privacy policy. Then download the Positron installer for your platform (Windows, macOS, or Ubuntu) and CPU architecture. Afterward, follow the instructions below to complete the installation:
On Windows, double-click the downloaded
.exefile and follow the prompts. Then type “Positron” in the Start menu to launch the application.On macOS, open the downloaded
.dmgfile and drag the Positron icon into your Applications folder. You can start the application, for example, by using Spotlight Search (Command-SpaceCommand-Space) and typing “Positron”.-
On Ubuntu, run the following command in a Terminal window, replacing
/path/to/Positron-xxx.debwith the actual path to the downloaded.debfile:sudo apt install /path/to/Positron-xxx.debNext, run
positronin a Terminal window to open the application.
2.2.1 Positron’s User Interface
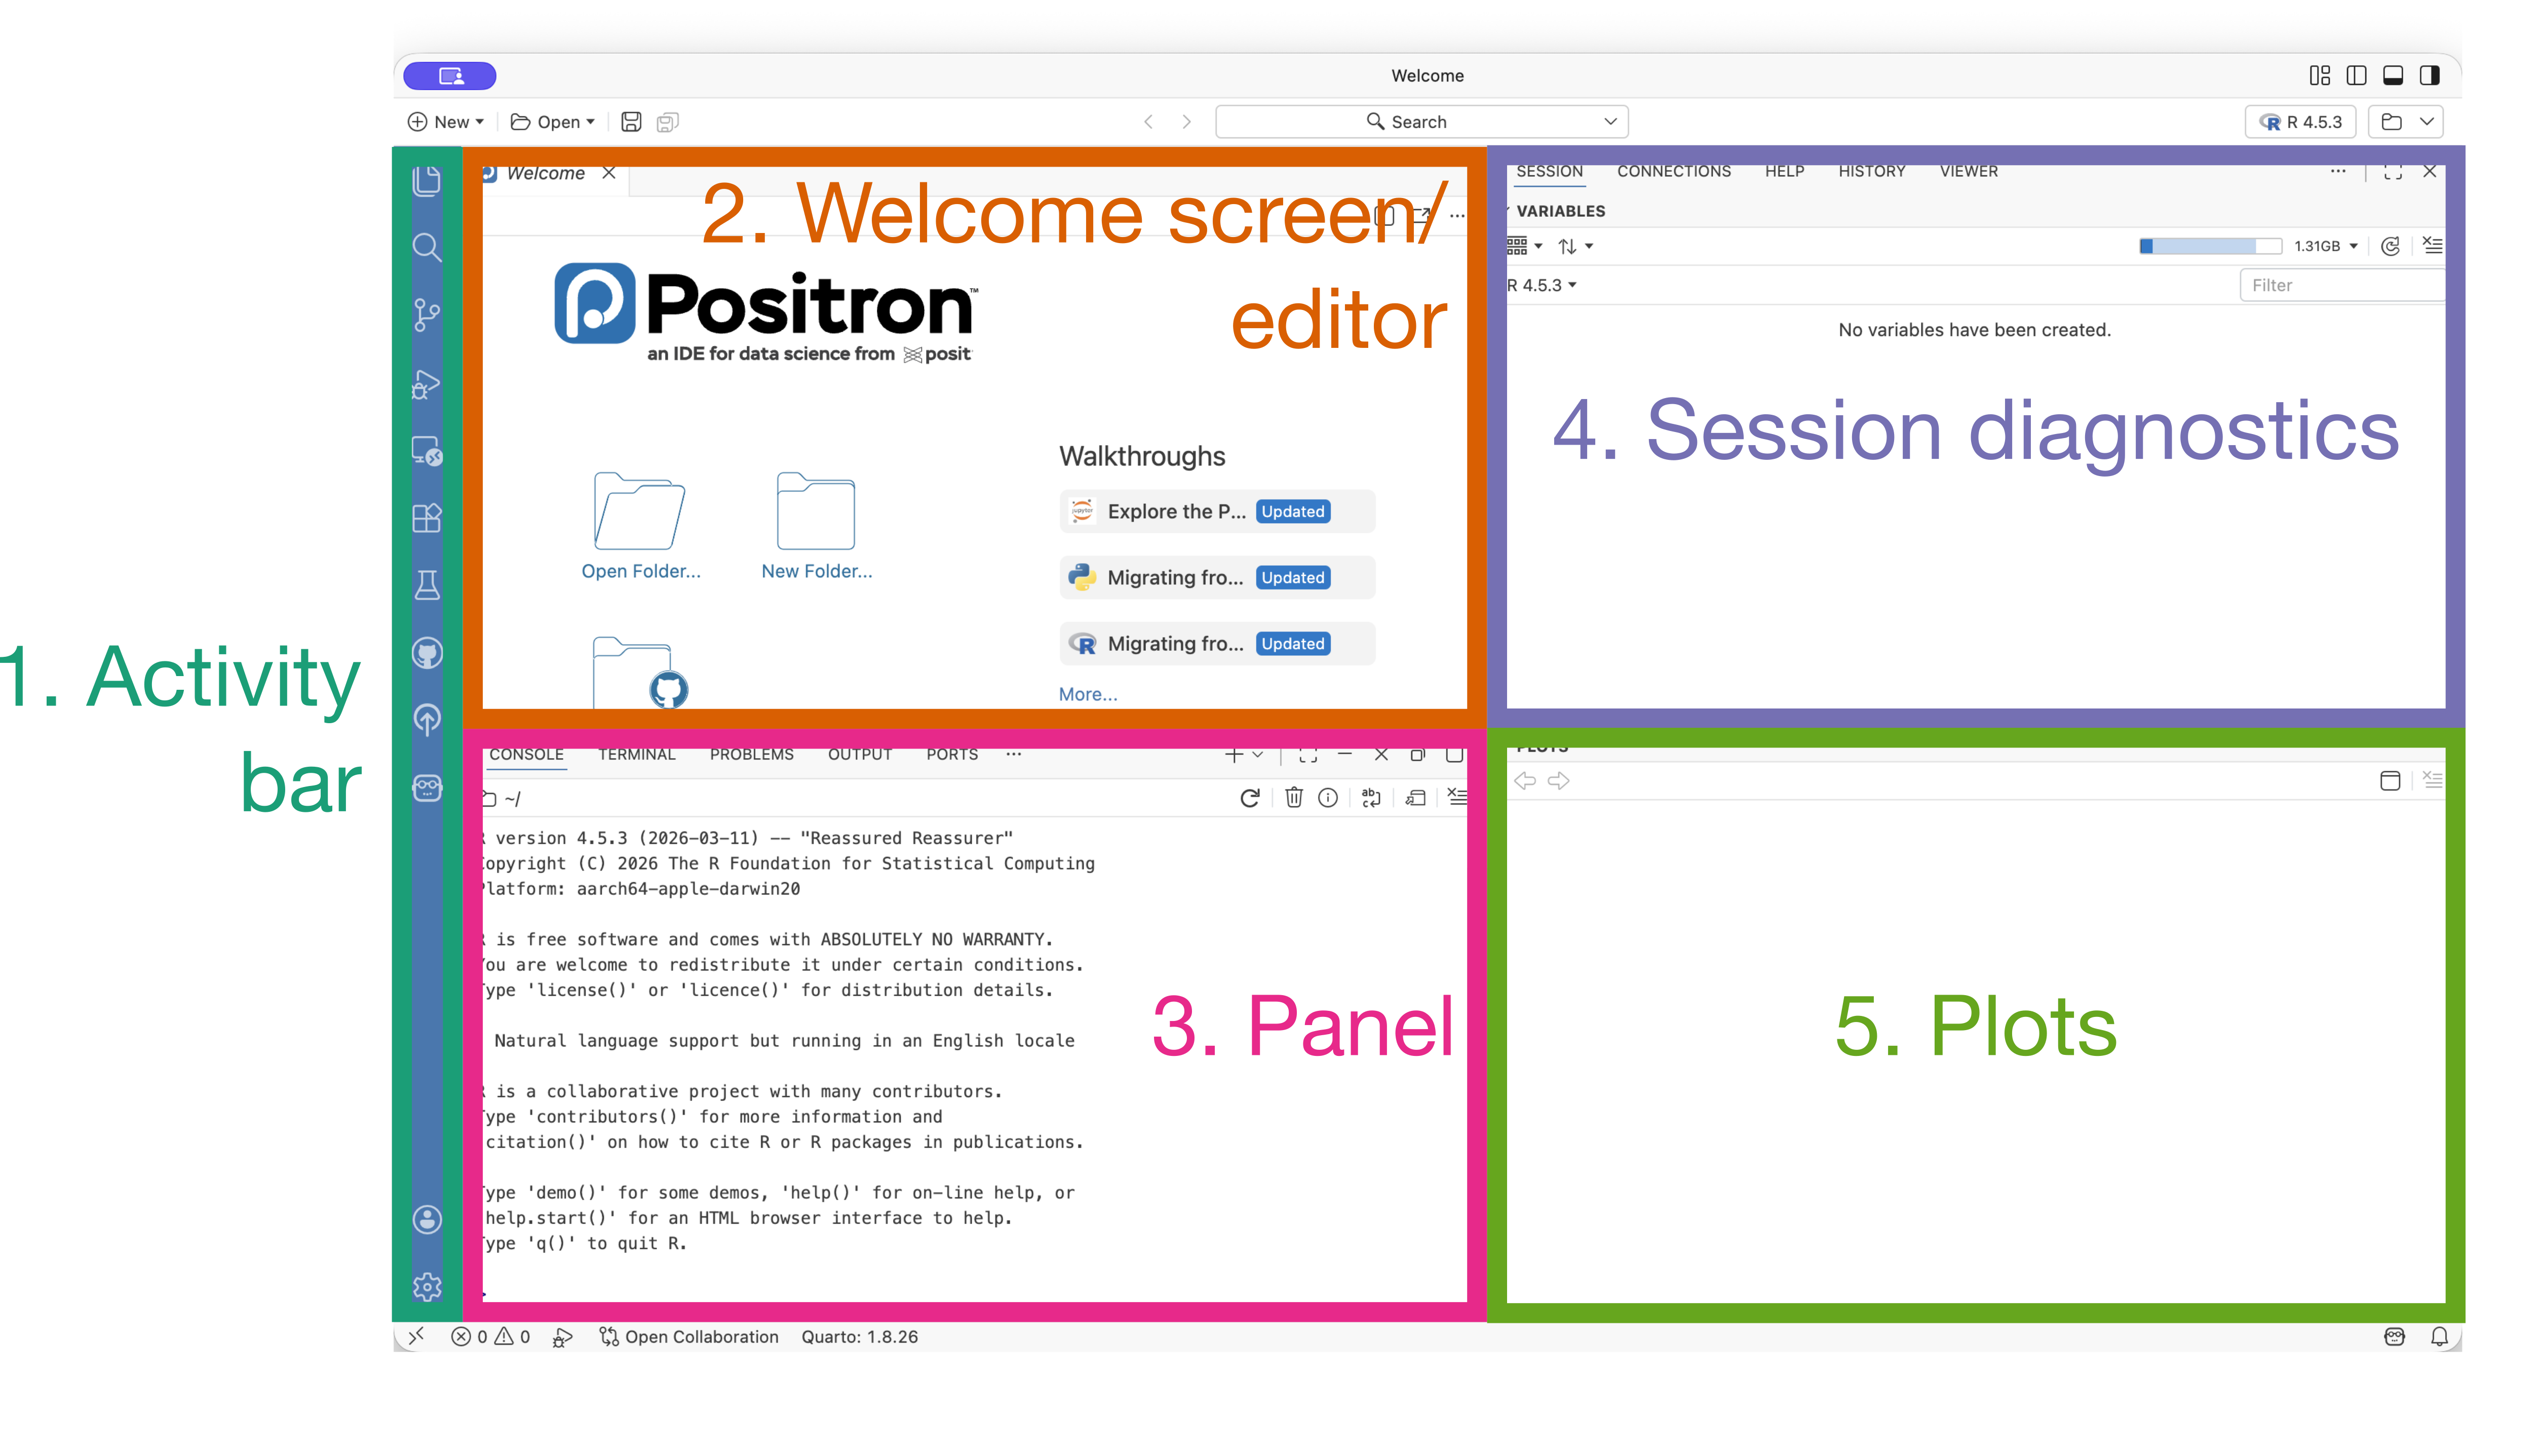
When Positron opens, you will see five main areas (Figure 2.1):
- The Activity Bar, located on the far left, contains shortcuts to different views and tools, such as the Explorer, Search, Source Control, and Extensions.
- The Welcome Screen allows you to open existing folders or create new ones. The same screen also serves as a text editor for opened files.
- The Panel, located in the bottom left, contains tabs for the R or Python console and the integrated terminal.
- Session diagnostics are displayed in the top right corner.
- When generated from code, plots are displayed in the bottom right corner.
If any of the areas is invisible, it may be hidden under another area. You can reveal a hidden area or resize a visible one by dragging the dividers.
The Positron window is divided into five main areas, each serving a specific purpose, such as editing code, executing commands, inspecting variables, and displaying plots.
As you progress through this book, the functions of these areas and their respective tabs will become clearer and more intuitive.
2.2.2 Opening a Folder in Positron
When you start a new project in Positron, you typically create a folder that contains your code and data. Positron refers to a collection of folders with project-specific settings as a workspace.
To create a new project folder, choose one of the following options from the File menu:
- New Folder from Template: To follow along with the examples in this book, select the “R Project” template, which creates a folder structure suitable for R projects. In the subsequent dialogs, specify a folder name and location, select the most recent version of R, and click “Create.”
- New Folder from Git: If you are familiar with Git and wish to use an existing Git project, this option is a suitable alternative.
2.3 Configuring Positron
Before you start coding in Positron, it is advisable to configure a few settings that support a beginner-friendly workflow. First, I recommend automatically formatting code whenever you save it (Section 2.3.1). Then I suggest activating Positron Assistant (Section 2.3.2).
2.3.1 Formatting Code on Save
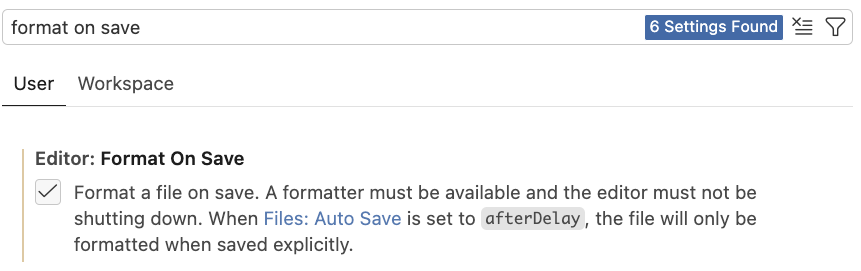
When sharing code with others, it is advisable to adopt a consistent style (such as indentation, whitespace, and line breaks). To enable automatic code formatting in Positron, click the gear icon in the lower-left corner and select “Settings.” Alternatively, you may use the keyboard shortcut . Then, in the search bar at the top of the Settings editor, type “format on save” and select the checkbox to enable the option (Figure 2.2).
I recommend Air as the formatter for R code. To enable it in your current workspace, first make sure that a folder is open. Then open the Command Palette () and start typing “Air: Initialize Workspace Folder.” When the command appears, select it.
Positron ships with Air, a code formatter for R that enforces a consistent style, making your code more readable and easier to share.
2.3.2 Enabling Positron Assistant
To enable Positron Assistant, click the robot icon in the Activity Bar, then select “Enable Positron Assistant.” These steps open the “Assistant: Enable” section in the Settings editor. Select the corresponding checkbox and restart Positron to activate the assistant.
Positron Assistant is a context-aware AI coding assistant.
Next, you must connect the assistant to one of the language model providers supported by Positron. Click the robot icon in the Activity Bar, select “Sign in to a provider,” and click the icon for your preferred provider (Figure 2.3).
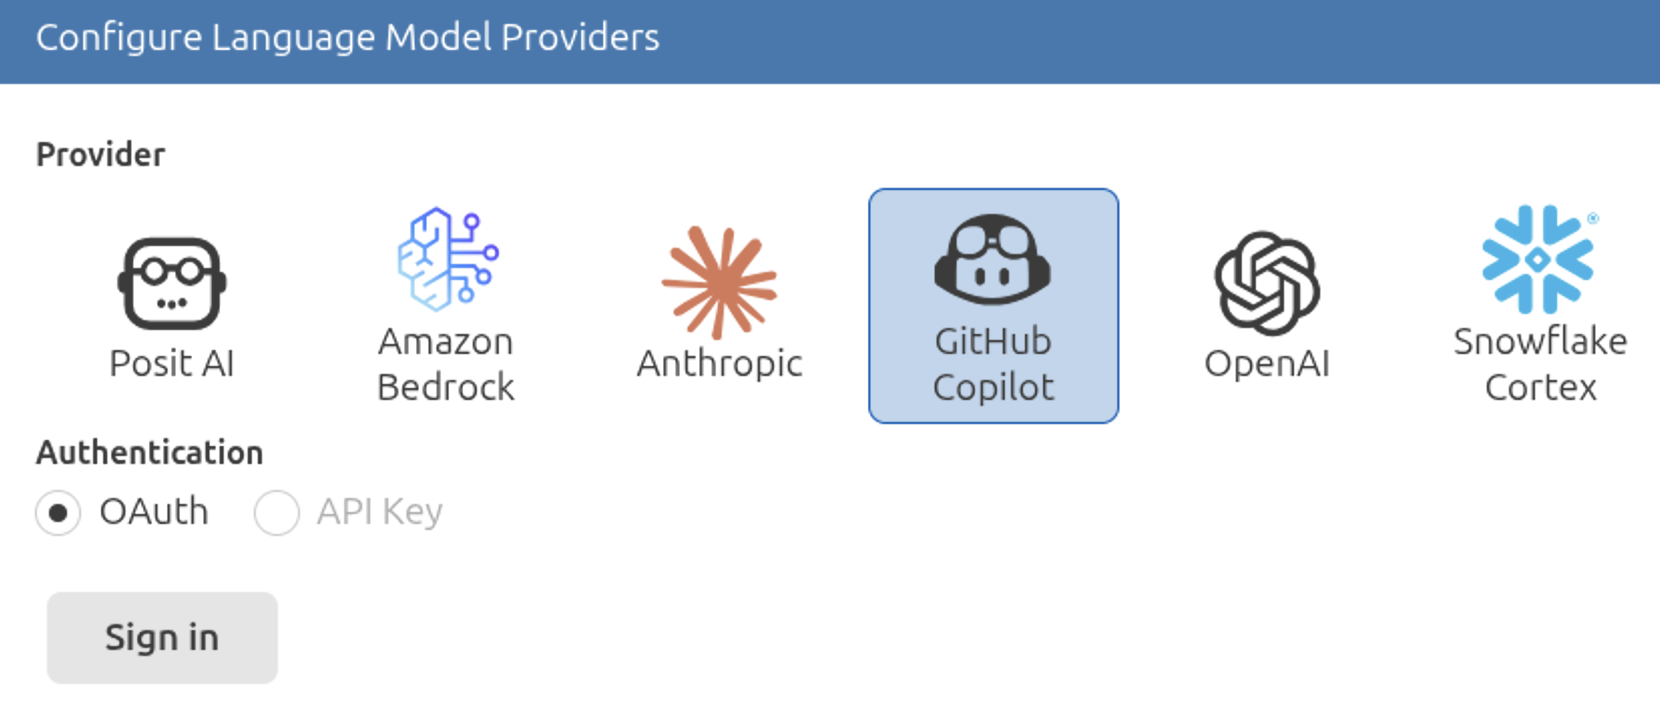
The next steps depend on your provider selection. For example, to configure GitHub Copilot, follow the prompts in both Positron and your browser to complete the GitHub sign-in process. If Positron displays a short verification code, click “Copy & Continue to GitHub” to open the authentication page in your browser. After signing in to your GitHub account, follow the on-screen instructions to complete authentication.
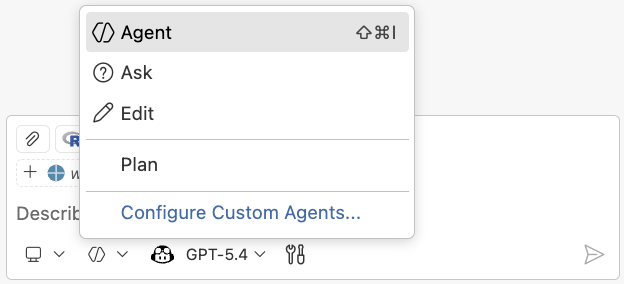
When you are signed in to your provider, you can choose among four built-in chat modes (Figure 2.4):
- Agent
- The assistant can search your codebase, read and write files, and run Terminal commands.
- Ask
- The assistant answers questions and suggests code, but it does not run commands or edit files automatically.
- Edit
- The assistant can edit files but cannot run commands.
- Plan
- The assistant drafts a step-by-step plan for your approval before making any changes.
Separate from the chat mode, your provider may offer multiple language models. For an independent comparison, see the Arena Text Leaderboard, which ranks models based on anonymous user votes.
2.4 Conclusion
Through this preparatory chapter, you have equipped yourself with essential tools for data analysis and visualization by installing and configuring R and Positron. You have also learned how to navigate the Positron user interface and set up Positron’s AI assistant.
The next chapter will apply this knowledge to generate Quarto documents using Positron.